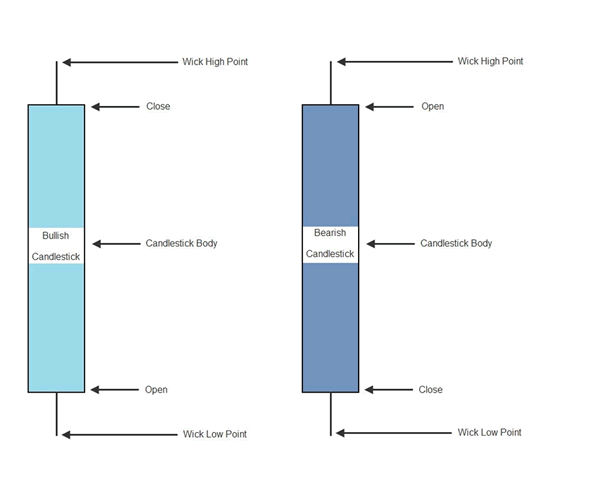
As far as monitoring price action is concerned, candlestick charts are the preferred chart type among traders, for this reason alone it is important to become familiar with them. The main reason for their popularity is that they are information dense relative to other charts and represent all the key features of price movement that a trader needs. Candlesticks consist of two main features, a body and a wick. In combination they provide traders with four essential pieces of information, the opening and closing prices within a given time frame, as well as the highest and lowest point an asset’s price has reached in that time.

The two colours ordinarily found on a candlestick chart represent bullish and bearish candlesticks (most charting platforms enable users to change colour schemes to their own liking). A bullish candlestick is one in which the opening price is lower than the closing price, in other words the asset in question is rising in value. A bearish candlestick is one in which the opening price is higher than the closing price, which means that the asset is dropping in value.
When charting at different time frames, (most charting platforms will offer scales from one minute to one month) a single candlestick always represents a single unit at that time scale. So at the one minute scale each candlestick describes all of the price activity that took place within that minute (the same goes for five minute charts, hourly charts, all the way up to monthly charts).
Essentially candlestick charts describe the battle that takes place between buyers and sellers in a given market. What makes them so useful to traders is that they represent all the information pertaining to that battle in a clear and succinct way, meaning that an educated trader can easily read them and quickly appraise what is taking place and what is likely to happen in the short term. It is fruitful to regard candlesticks as a language of sorts. All that has been described in this section is the basic candlestick structure, but candlesticks come in a variety of different shapes and sizes. Becoming familiar with all the different candlestick variations is akin to developing a broader vocabulary and being able to understand a more complex sentence structure. In the following sections we will provide a comprehensive breakdown of all the different types of candlesticks and what their appearance in an asset’s price chart suggests.


