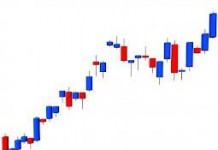
Binary option traders, as we mentioned in a previous tutorial, generally favour the use of candlestick charts for monitoring the price movement of their preferred assets. This tutorial will focus on engulfing candlesticks, adding to what we learned in the earlier tutorial about candlestick wicks, as well as dojis and pinbars.
Much like pinbar and doji candlesticks engulfing candlesticks are located at the bottom or the top of a trend and normally indicate that a change of direction is about to take place. The difference between these candlesticks and the ones we have discussed in earlier articles is that rather than “floating” on their own, engulfing candlesticks are found in pairs.
There are two types of engulfing candlestick, bullish and bearish. Bullish are typically found at the bottom of a trend and indicate a reversal where the asset is about to move back up. Bearish engulfing candlesticks are found at the top of a trend and indicate an imminent reversal where the asset’s value is due to head back down. What you should look out for in order to spot this type of candlestick configuration is the current close and the previous open. As already stated, engulfing candlesticks are typified by a large degree of overlap between neighbouring candles, so you are looking at an engulfing candlestick if the current one is bigger than the previous one, irrespective of where the current one opens.
The reason they are referred to as engulfing candlesticks is that the demonstrate a sudden increase in trading momentum in which the candle in question engulfs the previous candles opening. This typically occurs where assets are either being overbought or oversold and thus are vulnerable to price reversals. So for example if an otherwise sinking asset is experiencing a massive short term price hike, causing the current candle to break past the opening level of the previous one, so even if the price is going in one direction the momentum caused the next one actively reverses the movement of the asset. Another thing to keep in mind is that the wicks are of little or no interest to you when monitoring an engulfing candle pair. The only thing that matters is is the current close engulfs the previous open in either direction.
Now even though this type of candlestick indicates a highly probably reversal of fortunes for an asset you are monitoring, it is nevertheless very important to remember that there’s nothing to say that the reversal will be immediate, or that it will not be choppy in nature. This is something that traders get a handle on as they become more proficient at appraising trading situations in real time and determining whether long or short term trades are in order. It’s important to keep in mind that in trading binary options duration can make you or break you. But more on this for a later tutorial. For now we advise you to practice spotting engulfing candlesticks on your charting platform of choice so that you can slowly develop a repertoire of techniques for assessing the markets.


