The reversal strategy is one of the first strategies that beginners start experimenting with when trading binary options. In fact most traders come to this strategy independently of any research. This is because it is pretty commonsensical. Essentially the reversal strategy is employed when a trader monitors the price action of an asset in order to try and determine when a reversal is imminent. A reversal takes place when an asset’s price begins to move in the opposite direction. An example of beginner reversal strategy would be the placement of PUT trades when an asset continues to rise unhindered and is approaching a highpoint in relation to former prices (or conversely CALL options when the opposite is true). This is initially done just by visually comparing current price action to previous levels at a variety of timescales, but there are a number of more sophisticated tools that can be used to track possible reversals and indicate entry points.
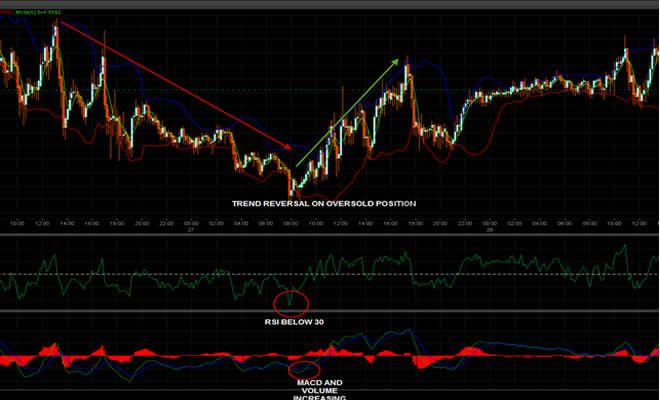
In the chart above a trader has been monitoring the GBP/USD currency pair during a prolonged downtrend. As you can see there are several points at which what appears to be a reversal takes place, but this is short lived and the currency pair continues to plunge. Had he only been monitoring price action visually he may have been enticed to erroneously enter a number of CALL trades that would have almost certainly expired out of the money. Instead he uses two separate technical indicators to confirm his instincts and provide trading signals at the most likely reversal points. The two technical indicators being used in this example are Relative Strength Index (RSI) and Moving Average Convergence Divergence (MACD). Although slightly beyond the scope of this article a brief explanation of how they work may be useful.
RSI is an indicator of momentum which compares the level of recent gains to losses in order to ascertain when an asset is either overbought or oversold. Typically when RSI is below 30 the asset in question is considered to be oversold, and when above 70 it is overbought.
MACD uses current price action to calculate the difference between an asset’s 26 day and 12 day exponential moving averages. It plots them on the same chart and uses the asset’s 9 day moving average to generate trading signals. When MACD moves above its 9 day average it is a good time to buy and when below this figure it is good to sell. In the above screenshot you can clearly see the asset’s price reaching its lowest point just as RSI drops below 30. The trading signal is confirmed shortly thereafter by MACD crossing its 9 day average. The trader purchases a CALL option as soon as RSI is confirmed by MACD and regardless of the expiration time selected the trade ends in the money.


