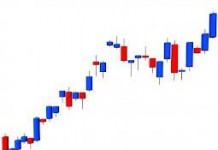
Candlesticks are the most useful and informative chart types for traders. Regardless of what you are already used to, this type of chart is definitely the one to get acquainted with. Now as far as chart time frames are concerned they are very dependent on what type of trader you are. Different traders will have different charting requirements. Intra-day traders (people who place trades that expire within a single day), day traders (who place trades that expire from one day to another), swing traders (who make weekly trades), and of course long-term traders will have what are known as different horizons for their trading activities.
Freestockcharts.com is a very good all round free online charting platform that provides you with high resolution charts in real time for a range of tradable assets. Each of their charts can be customised to display 1 minute, 2 minute, 3 minute, 5 minute, 10 minute, 15 minute, 30 minute, hourly, 2 hour, 4 hour, daily, 2 day, 3 day, 4 day, weekly, 6 day, 7 day, 9 day, monthly, quarterly and yearly charts respectively, thus covering all the bases that a trader could possibly need.
One important thing to bear in mind is that at different scales of time different trends become more apparent, for instance a choppy period of a currency pair’s movement at the 1 minute time scale, may look more interesting than it really is when you view the same date at the 15 minute resolution. At 15 minute intervals it may be revealed to have no action whatsoever. Of course the 1 minute view is essential for 60 Second trades but traders looking at longer expiries should definitely view the same graphs at different time scales in order to truly determine whether an asset is trending or not. The longer time scales really reveal when a market is in consolidation mode. Also, charting from the hourly mark and up provides you with a much wider data pool. When you chart at these time scales and above you get to see the way the asset you are charting has performed in previous days. You are made privy to about a week and a half worth of data at these resolutions which gives you added clues as to what is really going on in the market. Likewise if you chat at the weekly level you also receive data that relates to the past several years of a given asset’s market performance.


